Choosing a Terry Sock Machine in 2026 requires more than comparing prices and production speeds. The right machine must match your products, yarns, workspace, and daily output. A thick terry sport sock needs different settings from a lightweight home sock. Examine the cylinder size, needle range, terry depth, and available gauges carefully. These details affect softness, stretch, appearance, and waste.
Practical testing matters. Ask the supplier for sample socks made with your intended yarn. Inspect the inner loops, toe closure, heel shape, and elastic recovery under bright light. Listen for unusual vibration during operation. Check whether the control panel supports clear adjustments for loop height, pattern changes, and production monitoring. A reliable supplier should provide installation guidance, operator training, spare parts, and responsive technical support. Those services can matter more than a small difference in purchase price.
Do not assume the fastest machine is the best investment. High speed may increase defects when operators lack experience or maintenance time. Consider power consumption, cleaning access, lubrication points, and expected downtime. Request documented specifications and verify them through demonstrations or independent testing. Some advertised features may sound impressive but offer little value in your factory. That is worth questioning. The best Terry Sock Machine balances quality, flexibility, service, and long-term operating costs. Your decision may not be perfect. However, careful trials and honest production estimates can reduce expensive surprises in 2026.
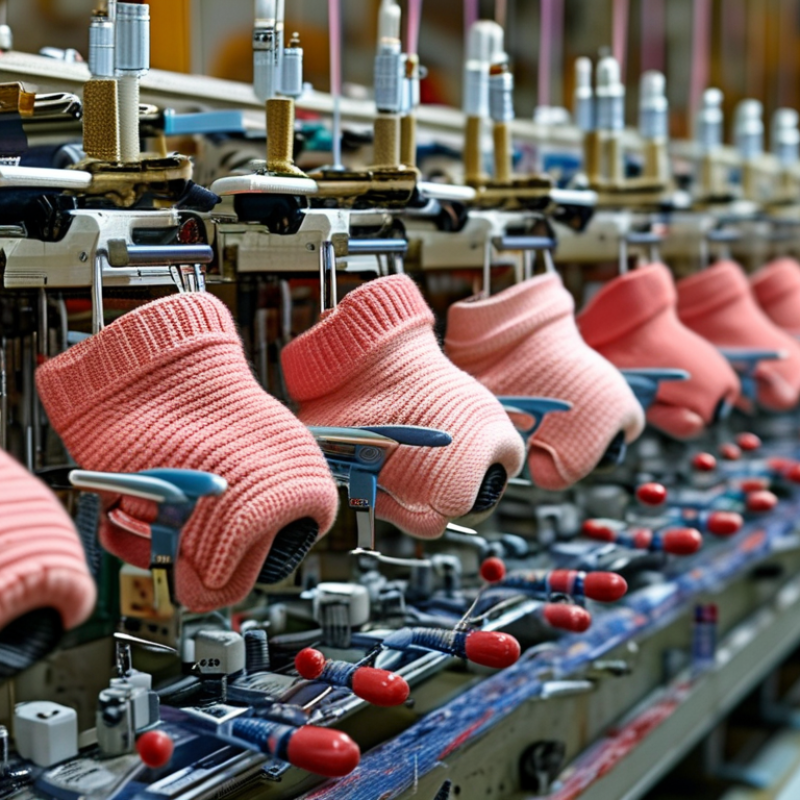
How to Choose a Terry Sock Machine in 2026
Define the product before comparing machines. Pile height controls softness, bulk, drying time, and yarn consumption. A 2–4 mm pile suits everyday athletic socks. A 4–6 mm pile creates warmer cushioning. Piles above 6 mm require stronger terry control and more stable yarn feeding. Measure the finished loop, not only the cylinder setting.
GSM gives the fabric a measurable weight. For many adult terry socks, 180–260 GSM supports daily comfort. Winter designs may exceed 300 GSM, but they need wider plating tolerance and slower production. These figures are practical workshop ranges, not universal standards. Textile Exchange’s Materials Market Report 2024 estimated global fiber production at 124 million tonnes in 2023. Polyester represented about 57%, while cotton represented about 19%. This reinforces the need to test fiber behavior, not chase one material.
Yarn count changes both appearance and machine load. Coarser yarns, such as Ne 16–24, build fuller loops. Finer yarns, around Ne 24–32, create lighter terry surfaces. A cotton-rich blend improves moisture comfort. Polyamide can improve abrasion resistance, while elastane supports recovery. The blend also changes tension settings and shrinkage. Ask for sample knitting with your actual yarn. Then inspect loop uniformity, heel transition, and washed GSM. Small defects often appear after laundering. They are easy to miss. Do not select a machine from catalog speed alone; real output depends on pile stability, yarn waste, and operator experience.
A 2–4 mm pile suits everyday athletic socks. A 4–6 mm pile provides warmer cushioning. Piles above 6 mm use more yarn and need steadier feeding. Measure the finished loop. Cylinder settings alone can mislead.
Many adult terry socks work well around 180–260 GSM. Winter styles may exceed 300 GSM. Heavier fabric usually needs slower production and wider plating tolerance. These are practical ranges, not fixed rules. Washing can change the result.
Coarser yarns, such as Ne 16–24, create fuller loops. Finer yarns, around Ne 24–32, produce lighter surfaces. A cotton-rich blend may improve moisture comfort. Polyamide can improve abrasion resistance. Elastane supports recovery.
Yarn blends change tension, shrinkage, and loop stability. Request sample knitting with the yarn used in production. Inspect the heel transition and loop uniformity. Then wash the samples. Small defects often appear later.
Compare them together. An 84–240-needle range creates noticeably different fabric structures. Lower counts often produce thicker, more open terry. Higher counts support finer stitches. The same needle count behaves differently across cylinder diameters.
A 3.5-inch cylinder suits smaller sizes and compact athletic socks.
Check yarn count records, feeder tension, stitch density, and terry timing. Use conditioned yarn samples during testing. Record yarn mass, skein length, tex, or denier. Compare those measurements with the control panel. A small mismatch can create uneven cushioning.
Test knitted samples from the machine, not only display swatches. Measure ankle and sole zones separately. Record strip dimensions, applied force, extension, and recovery. These areas rarely behave identically. The fabric may disagree with the screen.
Real output depends on pile stability, yarn waste, and operator experience. Ask for hourly output and waste-rate records. Check performance using your yarn and target pile height. A showroom sample can hide tension problems. Speed is not everything.
Do not adjust stitch settings immediately when fabric looks uneven. First check yarn variation and feeder behavior. Review washed GSM and loop height afterward. Controls improve repeatability, but they do not replace inspection. Some judgment remains necessary.
Choosing the right Terry Sock Machine in 2026 starts with clearly defining production requirements. Evaluate terry pile height, fabric weight in GSM, yarn count, and fiber blend to ensure the machine can deliver the desired softness, absorbency, durability, and fit. Next, compare cylinder options from 84 to 240 needles, along with 3.5- to 4.5-inch diameters and suitable gauges. These specifications influence sock size, texture, pattern detail, and production flexibility.
Performance should be measured through stitches per minute, pairs per hour, consistency, and defect rates rather than speed alone. Confirm that the machine’s controls support reliable yarn-count verification aligned with ISO 2060 and stretch testing consistent with EN 14704. Finally, calculate five-year total cost of ownership by including electricity, compressed-air consumption, routine maintenance, replacement parts, operator requirements, and potential downtime. A balanced decision considers product quality, measurable output, testing capability, and long-term operating costs.

 Rainbowe